
Products
You are here:- Home | PANORAMA LDS
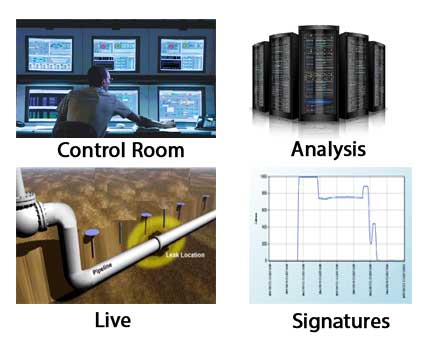
PAnORaMA LDS
PAnORaMA is a Piping Analysis, Operations Research and Maintenance Application which analyses flow, pressure and other data using pre-recorded signatures created by applying complex mathematical models to detect a leak accurately within specified performance parameters.
Features
• Finite difference method with adequate degree of discretization
• Efficient and robust algorithm
• Completely stand-alone simulation
• Gas or liquid systems
• Tree or loop networks
• Convergent solution guaranteed
• Real-time application possible
• SCADA functions in-built
• No limit on network complexity
Applications
• Leak detection with leak location within specified performance parameters
• Monitoring system pressures at critical locations
• Predictive “what-if” analysis
• Optimization and planning of operations
• Simulation (gas or liquid networks)
• Expansion of the existing pipeline
• Commerce (Shrinkage, line pack, billing etc.)
• Operator training and retraining
• SCADA functions (trending, historian, report generation)
Benefits
• Improvements in efficiency by pre-identifying possible problems
• Optimization of Inventory and capacity management
• Helps meet statutory requirements
• Protects environment by minimizing Impact of a leak by early and precise detection
• Reduced losses
• Attainment of social objectives
• Reduction in litigation costs
Applicability
• Cross-Country Pipeline & Sub-Sea Pipeline
• City Gas Distribution systems
• District Cooling Systems
• Liquid or Gas, Small or Big Networks
• In-Plant Networks
• Municipal water networks
• Any Network: Tree, Loop
This is a customized LDS (Leak Detection System) application for a network. This is a real time version of PAnORaMA and is useful for pipe network operators.
The simulation model of any existing network can be 'tuned' using actual performance data to ensure that it captures the current status of the network and is very predictive in nature. PAnORaMA supports such tuning on demand. Once tuned, the simulation becomes a virtual network imaging the actual network and the SCADA data would match predictions from the model running in real time.
Pressures at various nodes in the network serve as a pulse of the network indicating pipeline health. A tuned simulation model would predict pressures at the network nodes which would normally compare (or can be made to match through tuning) with the data reported by SCADA. When the simulation begins to deviate from the field data, it is attributed to some fault that has developed into the actual network. For example, if the simulated and actual pressure differs only at one node and matches everywhere else, it could indicate a local instrument malfunction. However, if simulated pressures, which were matching well with field data till certain instant, suddenly seem to deviate from actual pressures all over the network, it indicates a fault which has developed and whose implications are radiating out from some point and engulfing the whole network. It points to an event which has changed the actual system hydraulics, such as a leakage. PAnORaMA compares its predicted pressure profile in the network with reported pressures at all times and creates an alarm when a spreading deviation is seen which is likely to be a leakage.
The leakage would affect the pressure measurements at nodes in its vicinity earlier as compared to far off nodes. PAnORaMA uses the deviation pattern and analyses it closely to locate the epicentre of the problem (the leak location).
PAnORaMA then confirms the leak location and also its quantum through simulations done with systematically sliding the leak location around such tentatively identified location. The leak is created in the simulation and its magnitude varied so as to match the simulated network performance with the actual network performance. The location and magnitude of leakage which restores the parity between simulation and actual field data is reported.
To speed up the leak localization and quantification, PAnORaMA has a provision to create virtual leakages (in simulation) at several locations, one at a time and see how the network responds to it. The response is captured as a pattern. PAnORaMA maintains through such off-line exercise a response pattern library for different leak locations. As soon as a leak is detected, the field data is used to construct its pattern and the same is compared with pre-created and stored response patterns to arrive at a tentative location quickly. Pattern recognition is used for this purpose.
The leak detection by PAnORaMA is thus based on simulation, pattern recognition and also statistics to some extent. The philosophy is unique and prediction accuracy can be continuously improved by tuning the application through physically and deliberately created leakages as well as leakages that may be caused and confirmed during the network's life-time. PAnORaMA is a self-learning application in that sense.
Real-time PAnORaMA can also be used as an operator training tool using its additional feature of creating an 'Emulation' by giving instrumentation data of the network with their least count, accuracy, random noise etc. Emulation can then replace the actual network in which instructor can create changes and faults and see Operator's response. Emulation can also be used to test leak detection capabilities by creating leakage on emulation and serving this data as actual and testing whether the LDS can detect its location and quantum. This facility can also be used to test other third party LDS tools already installed on any given network.
PAnORaMA's Leak Detection Capabilities have been extensively tested using such rigorous testing methods. This facility can also be used to ascertain what leak detection accuracy can be achieved given the existing instrumentation accuracy. It can also be used to decide as to what accuracy the instruments should have to detect leakage to a desired accuracy (quantity as well location) in a new project.
The LDS feature of PAnORaMA needs a network simulation to be created as a first step. Once this is done, Leak Pattern Library which captures the signature of the impact of leakage at different locations (virtual nodes) can be created. The leakage is simulated by visualizing it as a valve opened at the leakage location. The quantity of leakage is regulated by the coefficient of this valve. The user also has a facility to specify the environment outside the pipe at the leak location because that also has impact on actual leakage rate. For example, if the pipe is laid on a river bed or sea bed and is under hydrostatic pressure exerted by the water column, the leakage flow rate will be less as compared to when the pipe is exposed to atmosphere at the leakage location. The facility is provided wherein the user can create a pattern library by specifying these factors which govern the net rate of leakage.
Once this preparatory work is done, the application is ready for leak detection. As and when the leak occurs, the LDS predicts the leakage event within a short time and displays its possible locations with their estimated confidence ratings. If the best confidence rating itself is poor, the alarm could be ignored by the operator. What is tantamount to a spurious alarm will evolve over time as the LDS trains itself over a period of time by tuning the simulation backbone by using actual operating data periodically.
The simulation power that PAnORaMA creates and bases its usage on allows any decision making to be rooted in physics and makes it very reliable.