
Information
You are here:- Home | Graphical Representation
Graphical Representation
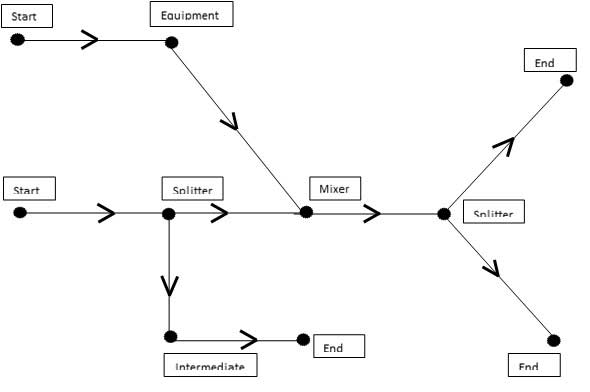
Figure 1a: Schematic of a Tree Network
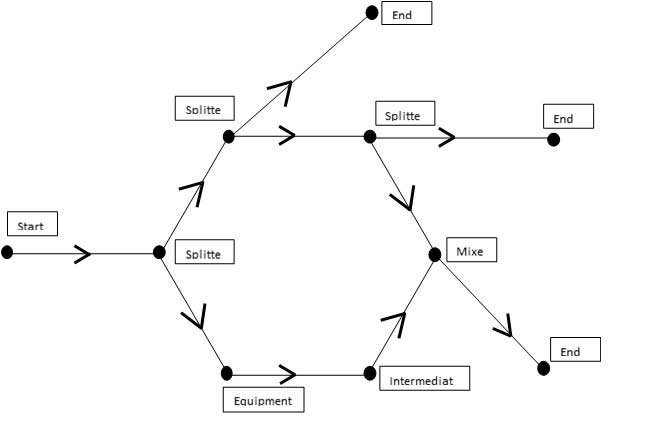
Figure 1b: Schematic of a Loop network
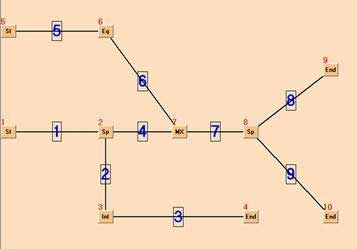
Figure 2a: Tree network in PAnORaMA
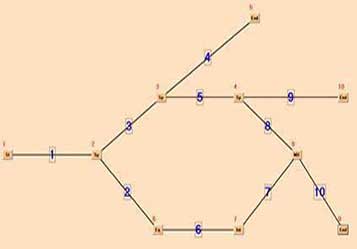
Figure 2a: Loop network in PAnORaMA
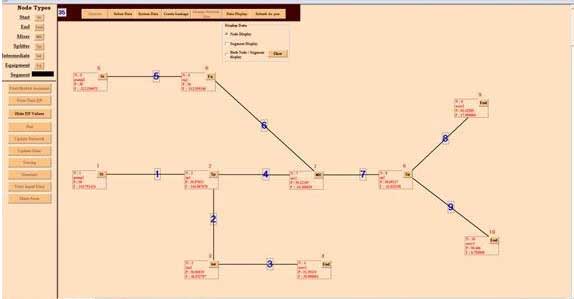
Figure 3a: Live display of node data
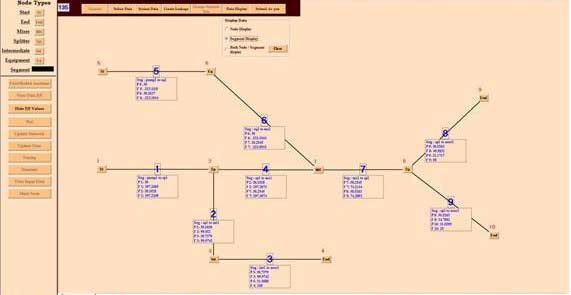
Figure 3b: Live display of Segment data
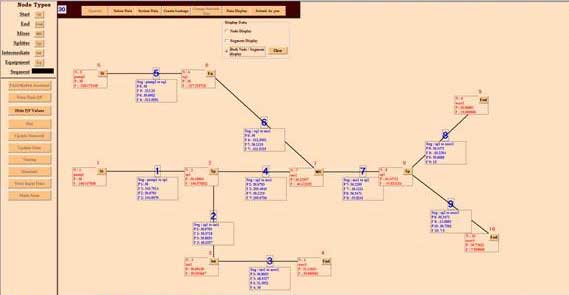
Figure 3c: Live display of both Node and Segment data
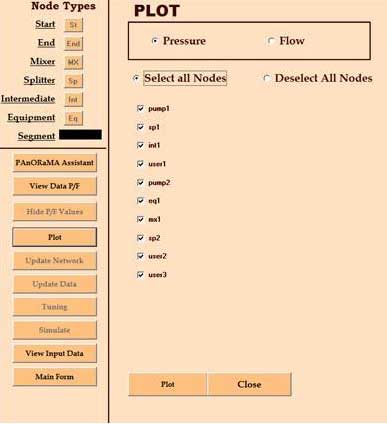
Figure 4a: Selection for Pressure plots
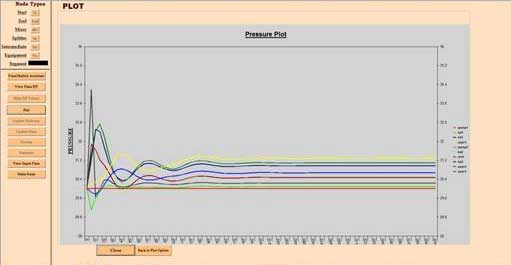
Figure 4b: Graphical display of Pressure plots
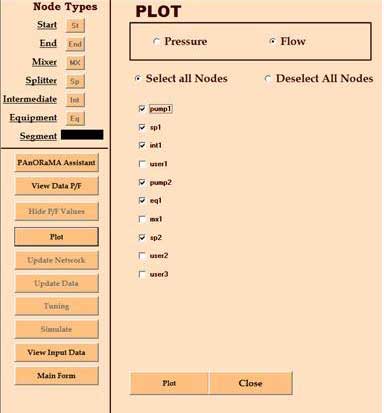
Figure 5a: Selection for Flow plots
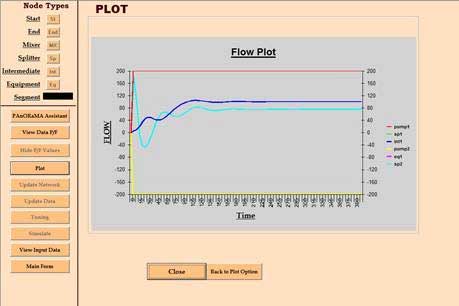
Figure 5b: Graphical display of Flow plots
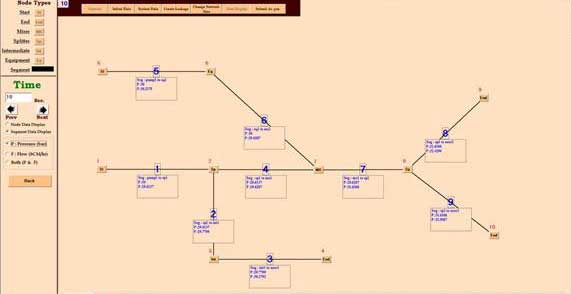
Figure 6: Post simulation viewing of results
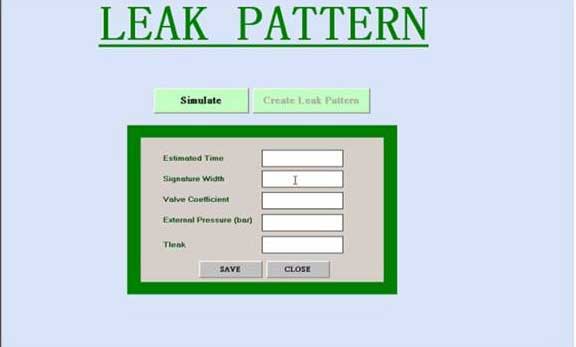
Figure 7: Pattern library creation
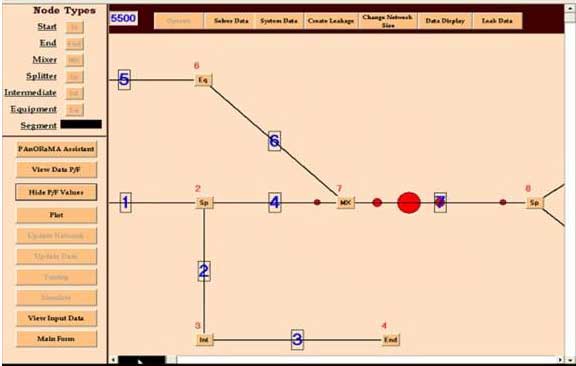
Figure 8a: Display of leak location on network
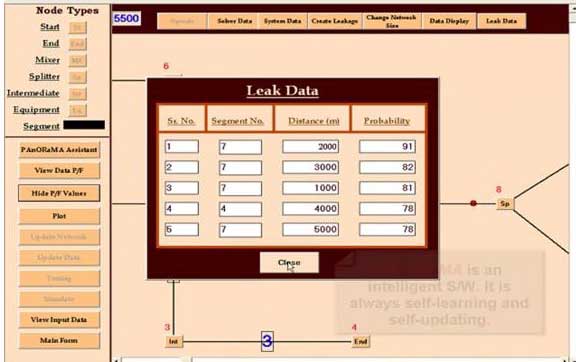
Figure 8b: Display of confidence levels in leak location